Population
Age and Gender
Figure 2.3 Number of male and female residents by age group in 2010 in the City of Kelso.
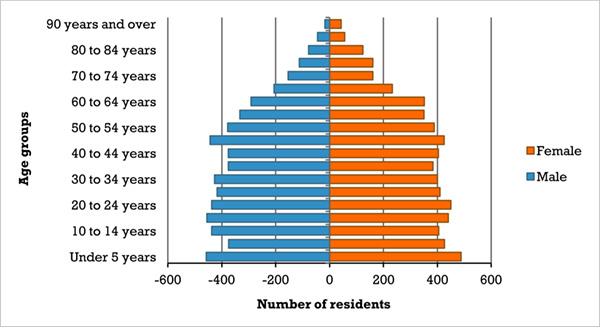
Source: U.S. Census Bureau’s 2010 Decennial Census; Table QT-P1 2010 Census Summary File 1 Age Groups and Sex.
Figure 2.4 Number of male and female residents by age group in 2010 in the State of Washington.
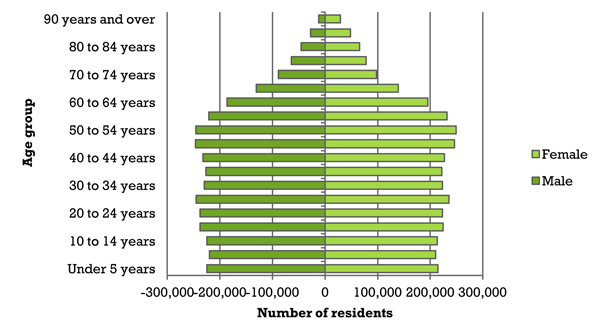
Source: U.S. Census Bureau’s 2010 Decennial Census; Table QT-P1 2010 Census Summary File 1 Age Groups and Sex.
Education
Educational Attainment
Figure 3.1 Shares of Kelso residents age 25 years and over by highest level of educational attainment.
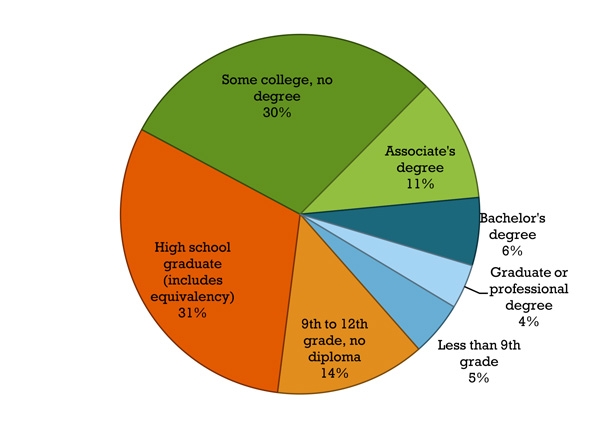
Source: US Census Bureau’s American Community Survey 2007-2011 5-year estimates; Table S1501: Educational Attainment.
Economy
Employment Shares by Industry
Figure 4.1 Shares of civilian workers age 16 years and over by industry in the City of Kelso.
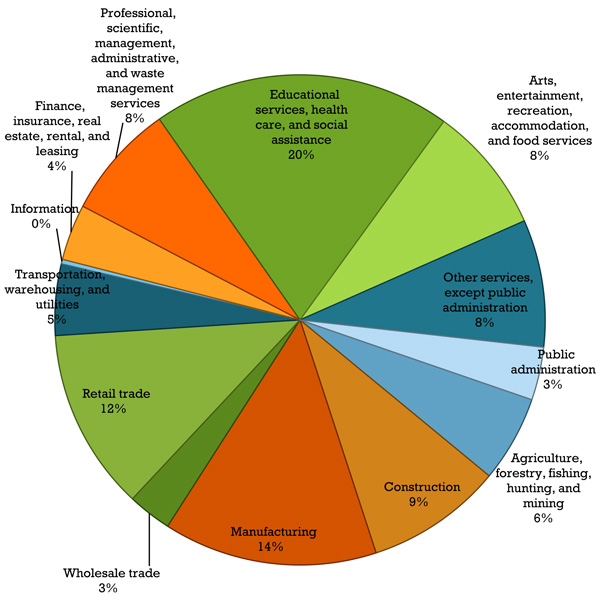
Source: U.S. Census Bureau’s American Community Survey 2007-2011 5-year estimates; Table DP03-Selected Economic Characteristics.
Housing
Shares of Housing Units by Tenure
Figure 5.1 Owner-occupied vs renter-occupied housing units in the City of Kelso and Washington State.
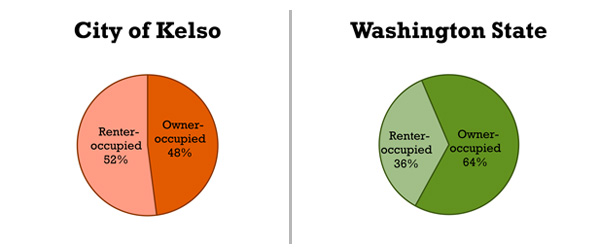
Source: U.S. Census Bureau’s 2007-2011 American Community Survey 5-year estimates; Table DP04 - Selected Housing Characteristics.
Transportation
Mode of Transportation to Work
Figure 6.1 Means of transportation taken to work by City of Kelso residents.
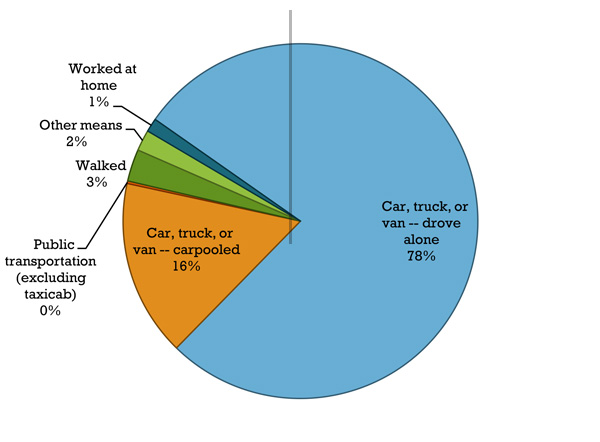
Source: U.S. Census Bureau’s American Community Survey 2007-2011 5-year estimates; Table DP03-Selected Economic Characteristics.